|
Assimilation, sometimes known as integration or incorporation, is the process by which the characteristics of members of immigrant groups and host societies come to resemble one another. That process, which has both economic and sociocultural dimensions, begins with the immigrant generation and continues through the second generation and beyond. This wiki examines the situation of immigrant workers in the United Kingdom and the United States. In keeping with the literature we use the term assimilation to describe the process of convergence between migrants and their native born counterparts in an outcome of interest such as average earnings. It has been widely recognized that immigrant workers tend to face disadvantage in the labour market, both in terms of their employment and earnings experience. However, this work also shows that the experience of immigrants is very heterogeneous. Immigrants from different ethnic backgrounds also tend to fare differently. But also immigrants who have been in the U.K. and the U.S. for longer also tend to do better. In particular, the work of Borjas has examined the assimilation of immigrants into the U.S. However, there is little work on the assimilation of immigrants into the British labour market. Chiswick was the first to analyse this issue. More recently, Bell examines assimilation of wages of different immigrant groups using retrospective data from the General Household Survey. |
|

Immigration Trends in the UK and US
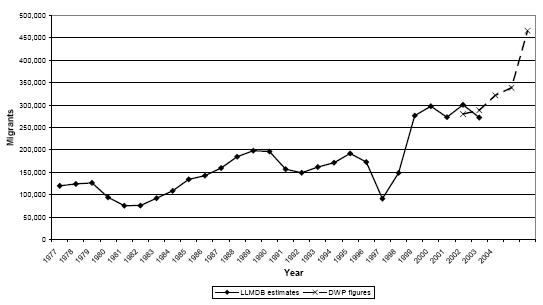
United Kingdom
United States
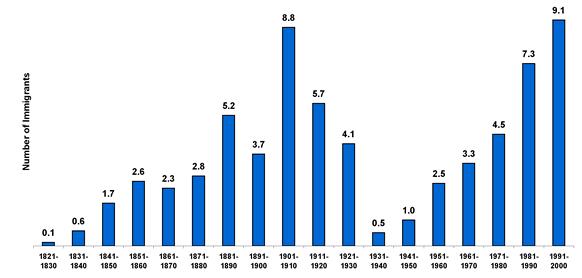
The war with Britain slowed down immigration to the U.S and did not really take off till the 1830s. The potato famine in Ireland caused a huge jump in immigration in the 50s. The pattern of European continued until the early 20th century.
| To Top |
|

U.S Literature
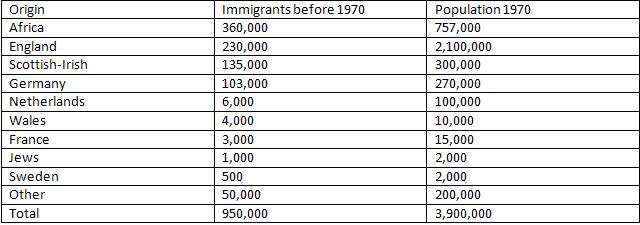
True Assimilation Chiswick (1978) analyzed the earnings of immigrant adult white men in the US. He took a cross section of data, from the 1970 census of population, giving a snap shot of the US population at this time. This allowed Chiswick to compare the current earnings of newly arrived immigrants with the current earnings of immigrants who arrived years before. He analysed these earnings through comparisons with the native born and among the foreign born by country of origin, years in the United States and citizenship. Differences in the effects of schooling and post school training were also explored.
Assimilation theory, supported by Chiswick (1978), offers the following explanations for the results:
Effect of Schooling Chiswick also found a smaller effect of post-immigration schooling for foreign born men. He discussed that this may be due in part to self- selection in migration, stating that maybe only the most able and most highly motivated of those with little schooling migrate while those with higher levels of schooling (or who subsequently acquire) came from a broader ability and motivation spectrum. Chiswick(1980) 2 analysed the earnings of immigrants in Britain. Of the sample of 5578 men 6.2% were foreign born. Chiswick found that the annual earnings foreign born men were 4 per cent lower than that of native - born white men. Importantly he found that when holding all other variables constant (e.g. schooling, location and including post school training), the number of years since the person migrated to Britain has no additional explanatory power. This means that for immigrants in Britain labour market experience in Britain and in the country of origin are equally productive, this does not support true assimilation. Chiswick (1980) explained this by the fact that those who had come to Britain in the 20 years before 1970 were well "anglicised" before they arrived. This was backed up by the fact that a large proportion of the immigrants had come from English - speaking commonwealth countries. He is suggesting that this wave of immigrants arrived in the UK with a high level of human capital already, with little potential to assimilate. However he did find a small effect of schooling on earnings when looking at non - white immigrants, suggesting they had received a lower quality of schooling. Assimilation and Cohort-Effects The key difference that cohort analysis reveals compared to Chiswick work is that it takes into account the quality of immigrants coming into the United States over time. This is a contrast with Chiswick's work in which he studies cross-sectional data and makes inferences about how earnings of immigrants evolve overtime. Borjas revolutionized the way labour economists thought about immigration in the U.S and his first paper with cohort analysis. What is a cohort?A cohort is a group of subjects who have shared a particular experience during a particular time span (e.g., people born in 1950; Mexican women born in 1950). Cohorts may be tracked over extended periods of time in a cohort study. Put simply, it is a group of individuals having a statistical factor in common.
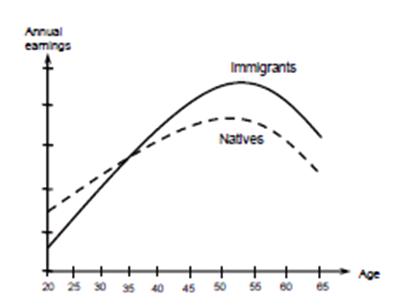
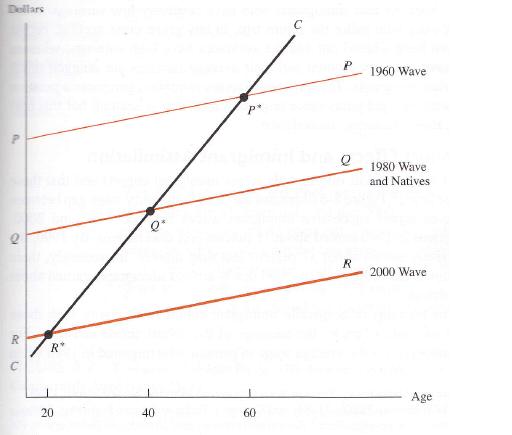
Consider a hypothetical situation where there are three separate waves of immigration, the first in 1960, the second in 1980 and the last in 2000. Suppose also that all immigrates enter the U.S at the age of 20. We assume the following:
The graph shows that age-earnings profile of the immigrants is parallel with native workers and do not converge like the previous work on assimilation.
EvidenceThe example above has striking parallels with the experience of immigrants in the United States. Immigrants in the 1960s were largely from Europe and Canada, and skilled. The productivity of immigrant workers has seen a sharp decline since then, due to the shift in immigration patterns.
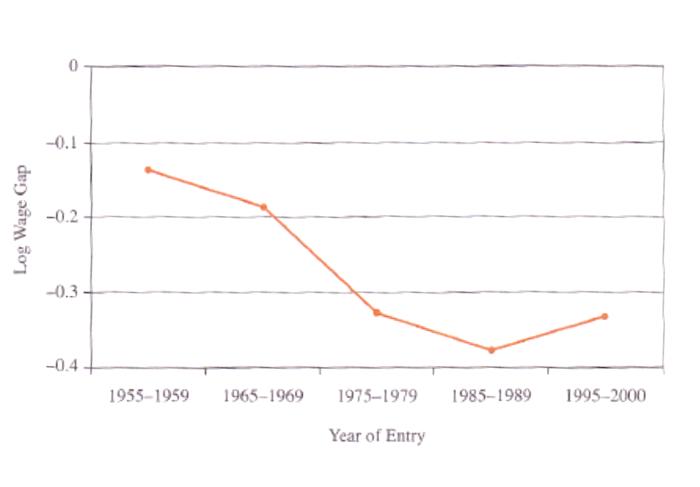
To determine whether specific cohorts (as opposed to immigrants in general) reached parity with natives, track studies were conducted that followed immigrants after entry. For example, Borjas looked at immigrant wages of those who arrived in the 70s using the 1980 census and tracked their wage increases using the 1990 census then the 2000 census and so on. The figure below illustrates the evidence provided by this type of tracking study.
There is a big gap between earnings of those who arrived in the 1960s and those who arrived in 1970, the wage they received upon entry was higher. Those who arrived in the 60s and 70s usually caught up or exceeded native wages. While only a small percentage of those arriving in later cohorts either caught up with natives, or did not catch up at all.
The Data: How Best to Measure Assimilation? Chiswick (1978) analyzed the earnings of immigrant adult white men in the U.S. He took a cross section of data from the 1970 census of population, giving a snap shot of the US population at this time. Chiswick aimed to compare the current earnings of newly arrived immigrants with that of immigrants who arrived years before. His analysis did not involve tracking or monitoring of a group of immigrants over time, rather he only compared wages of newly arrived immigrants with immigrants already in the country. Borjas's work sheds light on the importance of having the right data when analysing assimilations patterns. Chicwick's simplistic analysis does not consider the need to assess the evolution of quality/productivity of immigrants across time. The data therefore that is of most importance in showing the actual picture of assimilation is data that shows not only age, earnings and place of birth but also length of time in the country. Ideally, we would like to compare a sample of immigrants over the years after they migrated into the US and compare their earnings year on year. This time series rather than cross section approach would give us stronger evidence. Obtaining dates concerning entry of immigrants and reliable data about wages is not straight forward. As many of a third of immigrants into the U.S are illegal and accurate information that reflects true numbers is not available. Unemployment and the Relative Earnings of Immigrants Barth et al. (2004) linked individual earnings to the unemployment rate in the local labour market. By allowing such linkages to differ for immigrant and native workers they estimated assimilation effects accounting for differential responsiveness of immigrants and natives to changes in macroeconomic conditions. They found that in periods of increasing unemployment, the standard methodology tends to underestimate both the assimilation process and any growth in cohort changes.5 Studies of immigrants in Canada and the US indicate that their job rates fall more than those of native during economic downturns (McDonald and Worsick (1997) ). Where years since migration have a positive impact on immigrant wages relative to those of natives, higher unemployment has a negative effect. Work less hours, hampers accumulation of skills, worse job prospects -> earnings are reduced.
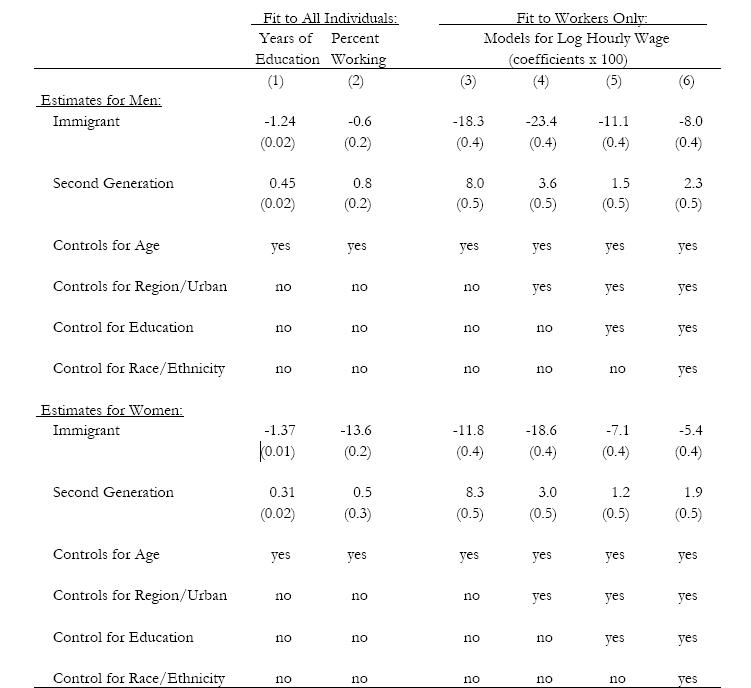
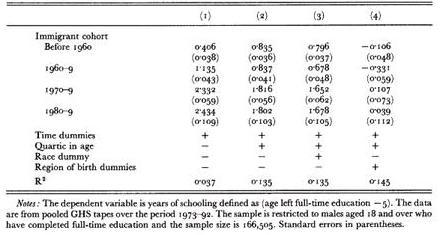
Second Generation and Assimilation The first education model shows that immigrants have 1.2-1.4 fewer years of education then natives. On the other hand, second generation immigrants have 0.3-0.4 years more education than people whose parents were born in the U.S, who are known as the "third and higher" generation. 6 Immigrant men are only slightly less likely to work than members of the third generation (children whose parents were born in the US), however on the other hand second generation men are more likely to work. Among women there is a larger immigrant gap in the probability of working women (13.6 percent lower annual employment rate than natives) but again second generation women are more likely to work than third and higher generation natives. . (David card 2005-Is the New Immigration Really So Bad?
The models in columns 3 and 4 present wage models that control for age and geographic location, but not for education. Among men, immigrants have 18-23 percent lower wages than third and higher generation natives, while second generation immigrants have 4-8 percent higher wages. The wage gaps for second generation women are similar for second generation men, whereas for immigrant women the wage gap is smaller than for immigrant men. This could reflect the relative selectivity of labour force participation among immigrant women. The higher wages of second generation immigrants can be largely explained by their geographic location and their higher education. The result from Table 2 concludes:
| To Top |
|


U.K Literature
Introduction Over time, they may adjust with respects to their UK-born peers, due to accumulation of skills, collection of information, and adoption of new habits. To understand how labour market performance of immigrants differs from UK-born, and from each other, how these differences relate to observed characteristics, and how they change over time is an important pre-requisite for migration policy. While adaptation and labour market performance of immigrant populations have been subject of intensive research in the US, Canada, Australia, and also in some European countries, relatively little is known about the absolute and relative performance of the immigrant community living in Britain. This section on UK labour market assimilation discusses the key literature in this area. Chiswick in 1980 looks at assimilation between non-white immigrants and natives. Bell (1997) considers ethnic minorities in more depth to see how labour market assimilation differs between them. Clark and Lindley (2009) take a slightly different approach by looking at immigrant labour market entrants and comparing them with immigrants who enter education first. The results for whites and non-whites have implications for UK immigration policy focus. Each of these papers analyses labour market assimilation in terms of employment possibilities and wage earnings. Chiswick (1980): The Earnings of White and Coloured Male Immigrants in BritainThis paper analyses the earnings of adult, white and non-white, immigrant men living in Britain in 1972. Chiswick found that whilst white immigrants earned largely as much as their native counterparts, there was a wage penalty of around 25% for non-white immigrants. He also found that their relative earnings disadvantage decreases with the number of years of schooling. Whilst this paper is useful for understanding wage disparities amongst white and non-white immigrants; the small sample size used (214 white immigrants and 127 black immigrants) from a single cross section of data (the 1972 General Household Survey) meant that further investigation into this topic was needed. It therefore formed the backdrop for the works of Clark and Lindley in 2006 and forthcoming. Bell (1997): The Performance of Immigrants in the United Kingdom
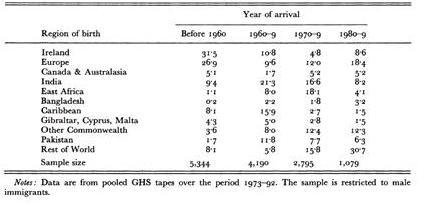
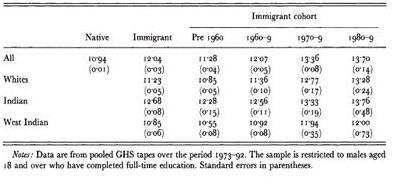
Bell writes his paper and tries to assess the performance of immigrants in the UK labour market using the results of the General Household Survey (GHS) between 1973-92. 7 Bell splits his study in to three main components focusing on the "changing national-origin mix of immigrants," "Educational attainment among immigrants" and "The wages of immigrants." While he looks at the differences between whites and non-whites, it does not become the focus unlike the Clark and Lindley paper; instead he differentiates between the origins of the immigrants, and splits their arrival into ten-yearly cohorts.
Educational Differences || Table 4
||
For the exact explanation of columns and the regression model used for the table, click here Columns three and four of Table 5 try to determine the growing gap between relative education of that of natives and immigrants. There are two main theories for this: 1. Immigrants are becoming more educated relative to natives irrespective of their origin of birth.
As seen in column three there is a big jump in relative education of immigrants between the 1960-9 and 1970-9 cohorts, this looks to be an anomaly, as it would be hard to have such a drastic change over one cohort, especially considering the regression from pre-1960 and 1960-9 cohorts.
Wage Findings For all immigrants foreign experience and education is valued less than British experience and education. However, for white and Old Commonwealth immigrants the impact is less detrimental than for other immigrants. This is because they are perceived to have an education and work experience similar to that of British natives and the language barrier is less of a problem. The cohort effects of wage regression have fallen over time, which may be due to a fall in quality of successive cohorts of Indian immigrants. Bell uses table 6 to help assess the impact of immigrant assimilation relative to native wages.
Immigrants from all countries, with the exception of white immigrants with 10 years experience, suffer a penalty for foreign experience (for reasons explained above). West Indians suffered the greatest entry differential, but they also experienced the greatest assimilation effects over the 30 years in the labour market. In all three categories they suffered from a worse entry wage than Indians, but by the end of the 30 years they had a better relative wage (than Indians) in all categories other than those with no foreign experience. The table below shows the assimilation of wages relative to that of similar natives.
Clark and Lindley - Immigrant Assimilation Pre and Post Labour Market Entry: Evidence from the UK Labour Force SurveyThis (2009) paper 9 uses Labour Force Survey (LFS) data from the period 1993-2004 to analyse the effects on earnings and employment for white and non-white immigrants; distinguishing between those that enter the labour market directly and those which first undertake some level of education in the UK. They classify the latter as 'education entrants' and the former as 'labour market entrants'. The methods and findings of this paper build directly on their previous study Clark and Lindley, 2006 but also the works of Chiswick, 1980 and Bell, 1997. The importance of distinguishing between these two types of immigrants stems from work by Kossoudji (1989) who notes both UK labour market assimilation and pre-labour market assimilation (in the UK education system). See Clark and Drinkwater(2008) for evidence of considerable diversity amongst non-white immigrants in terms of their labour market outcomes. Why is this work unique? The Modelling Framework  The equation controls for years since migration, human capital variables, etc. which aims to explain the differences in cohort quality; an important factor in "explaining immigrant earnings and performance in the UK and US" 9. Further reading on the US labour market can be obtained here.For a more detailed explanation of this model please see The paper does recognise the limitations of this framework. It notes that an unobservable bias may exist within the sample of UK immigrants: "the frequently analysed situation whereby those in employment are a selected sample of the entire labour force may only be one source of non-random selection on unobservable attributes. Immigrants themselves are likely to be a highly self-selected group (Borjas (1987))4 and the distinction between education and labour market entrants may also introduce further selection bias problems...immigrants may non-randomly remigrate which affects the interpretation of expected assimilation profiles." 9 An example of this is that non-whites in the 1960s and 1970s were found to have an advantage over other immigrants. "A large number of immigrants who arrived in the UK at this time were Asians who were expelled from East Africa [typically entrepreneurs or high status employees]...and it is possible that this finding reflects the arrival in the UK of this highly selected group of "twice immigrants'" 9. Labour Market Entrants
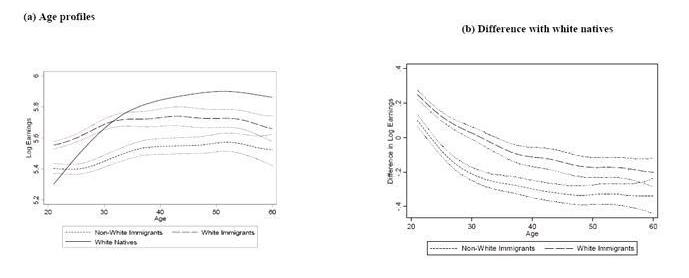
Figure 7 shows how the earnings premium for immigrants is eroded over time. It also shows how, compared with whites and natives, non-whites retain some form of penalty over their working lives.
Education Entrants
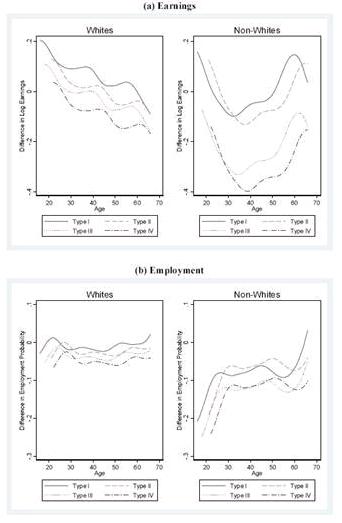
How does education abroad compare? Their study found that non-white labour market entrants have more potential labour market experience than whites, although they are fairly indistinguishable in terms of foreign education. It also asserts that, compared to non-whites, white education entrants have:
It is also of particular note that immigrants of all types have more total schooling than natives (on average). However, Clark and Lindley bring into question the quality of this education. The data would suggest that either schooling abroad is below the standard of UK schooling, or that there exists some irrational discrimination in the UK against overseas education standards. Summary
The greatest significance of the study is that it highlights the inadequacies of previous labour market assimilation theory. The results show that the distinction between labour market and education entrants is as important as that between white and non-white immigrants. For whites, education entrants generally perform better than labour market entrants, compared to natives. For non-whites, education entrants (who achieve degree-level qualifications) experience comparable levels of earnings and employment to whites (native and immigrant). Non-white labour market entrants' employment and earnings are, on average, lower than whites. This emphasises the importance of UK education for, in particular, non-white immigrants. Clark and Lindley do, however, point out the potential selection bias of education entrants, for both whites and non-whites, as a contributing factor to their labour market outcomes. Nevertheless, they do acknowledge a value in exposure to the UK education system: "This has implications for policies which are currently under discussion in the UK regarding the need for immigrants to undertake language and other types of training before being granted the right to remain. Our findings also suggest the importance of the UK education system as a passport to success" 9 | To Top |
|


Evidence from other countries
| Table 8: Outline of Readings
|
|---|
 |
Spain
Results from the paper by Catalina Amuedo-Dorantes and Sara de la Rica in 2006 'Labour Market Assimilation of Recent Immigrants in Spain' broadly shows the labour market performance of the immigrants in Spain widely depends on the originally nationality of the immigrant, with some of the EU15 immigrants reaching parity in occupational attainment with the similarly skilled natives. The data examined supported the notion of an upward occupational mobility and assimilation on the part of non-EU15 and Latino immigrants as their Spanish residencies lengthen. However in the case of the African immigrants, no clear pattern of occupational assimilation was found. In addition to this, another finding of the paper showed that the employability gap varies by gender (from 14% for male and 7% for females).11
Germany
Data from the paper 'Labour market segmentation and the earning of German guestworkers' by Amelie Constant and Douglas Massey shows that immigrants are initially less able than natives to translate their human capital into occupational status within the German labour market. Results from the paper indicate that immigrants experience significantly lower returns to education and vocational training than Germans. Additionally it was found that immigrants take on very low status jobs when they arrive and they remain in these jobs for some time before moving upward meaning there is a very high difference in the occupational attainment between the immigrants and the native workers. Lastly, by using the rates of return to experience the paper predicts it takes on average 23 years for immigrants to reach parity with the natives.12
Netherlands
Results from the paper 'Employment Assimilation of Immigrants in the Netherlands' by Aslan Zorlu and Joop Hartog in 2002 states that non-western immigrants significantly less likely to be employed that natives and the ones who are employed tend to be working in very low skilled jobs. Additionally, the evidence from the paper showed that the labour market performance of western immigrants did not differ from that of the natives as their skills are more transferable.
However, there was a sign of assimilation for all immigrants, even though it was much slower for non-western immigrants, the labour market performance significantly improved as their residence increases.
Interestingly, this paper also found that the effect of years since migration on employment was not sensitive to the years of education of the immigrants, fundamentally meaning education is insignificant in affecting the position of the immigrants.15
Sweden
Evidence from the paper 'Declining employment success of immigrant males in Sweden: Observed or unobserved characteristics?' by Pieter Bevelander and Helena Skyt Nielsen shows a strong pattern of assimilation for many of the immigrants, with employment probabilities of the immigrants is often recorded at as little as 10 years. However for some of the immigrants from the ex-Yugoslavian countries, the labour market performance differed vastly due to the decline in industrial activity, many of these immigrants were found unemployed with very few skills leaving the possibilities of employment assimilation scarce.13
Canada
The analysis of assimilation of the immigrants in Canada shows poor performance in the labour market. The paper 'The Performance of Immigrants in the Canadian Labour Market' by Michael Baker and Dwayne Benjamin in 2004 shows that there is a 20% wage gap in their first years with very modest rates of assimilation in the long term. If the future assimilation carries on in this fashion (similar to earlier cohorts) it looks that convergence/full assimilation of the immigrants to the natives in Canada is unattainable.14
Other indicators for assimilation
The large and increasing presence of immigrants in some of the largest countries in the world highlights the importance of monitoring immigrant health, since immigrant health (and the health of their descendants) has a larger impact on the overall health outcomes of these domestic populations.
Fundamental evidence shows that immigrants tend to arrive in the country healthier than the natives and that their health slowly assimilates towards that of the natives. This phenomenon was found from studies conducted in the US, Australia and Canada, from these results, the term HIE (Healthy immigrant effect) was created to try and explain why these results were found.
There are many reasons that have been suggested as to why this is the case. The paper 'Unhealthy Assimilation: Why Do Immigrants Converge to American Health Status Levels?' by Heather Antecol and Kelly Bedard suggests that immigrants are subject to selection and therefore are more likely to be in better health while the unhealthier immigrants more likely to return home. Another contradicting factor is acculturation. Exposure to a different environment (in this case the US) causes the immigrants to adopt native born behaviours such as diet and exercise, these have important health implications. This is the reason believed to be behind the BMI (body mass index) assimilation that was found in the US.
Lastly, it is generally thought that increasing income should be correlated to an increase in health for the immigrants, but due to relatively poor labour market performances in countries under this study (especially Canada), this is not usually the case and immigrants arrive healthier and their health deteriorates as the duration of stay increases.
Conclusion
United States
The lessons from the U.S. literature provide potentially valuable lessons to researchers in other contexts. Immigration is a major policy concern in many countries around the world. The relative success of immigrants in assimilating has been an important concern to economists and politicians alike. For almost half a century researchers have come up with different theories with varying degrees of success. Over the past two decades economists' perceptions of U.S. immigrants have shifted.
In the 1970s, immigrants were viewed in a mainly positive light. Chiswick (1978) found that immigrant men eventually earned more or equal wages compared with natives, despite having less education. He concluded that investments in on the job training made up for the gap in formal schooling. Furthermore, early theories on assimilation concluded that immigrants would overtake natives wage levels after 10-15 years from arriving in the U.S.
Subsequent research - particularly by Borjas (1985-2006) has chipped away at both conclusions and gradually led to a more negative picture of U.S immigration. The use of cohort analysis has shed new light on the way in which U.S immigration has shifted in the last 50 years and provides credible answers to the question of assimilation.
By analysing and tracking individual cohorts over time, a clearer picture of age-earning profiles reveals that immigrant wages in the U.S have evolved (declined) since the 1960s and this is due to the change in quality/productivity of immigrants. Skill characteristics of immigrants in the U.S. are strongly related to their country of origin. The use of cohort analysis allowed Borjas to point out that Chiswick's analysis will overstate earnings growth if more recent immigrant arrival cohorts have lower unmeasured skill characteristics than earlier arrivals, as is true in 1980 and 1990.
Subsequent research, most notably by Card showed that a narrow focus on immigrant earnings is misplaced. By looking at the experience of the offspring of immigrants after they settle in the U.S, more questions about assimilation can be answered. Few of the immigrants who come to the U.S. without a high school education will ever catch up with the average earnings of natives. However, most of their U.S.-born children will catch up with the children of natives.
The relatively strong educational progress of second generation immigrants, suggest that even the revisionist view of recent assimilation in the U.S may be overly pessimistic.
United Kingdom
The three key studies in British immigrant assimilation all expanded on one another, Chiswick only looked at one group from a Labour force survey, Bell broke the immigrants into groups, while Clark and Lindley made an important split between education and labour market entrants.
- Clark and Lindley find "considerable diversity in the patterns of immigrant earning and employment assimilation...The textbook model of assimilation...is not generally supported by these results" and that an important distinction must also be made, within policy focus, between different types of immigrant (Clark and Lindley, (2009), pp. 27).
- White immigrants seem to earn an initial premium over natives, which could possibly be due to the self-selection process.
- Their findings are consistent with Chiswick (1980) who, although based on a very small sample size, theorised that white immigrants had similar earnings to white natives but non-white immigrants earned considerably less. This was mainly due to lower returns to education and experience.
- There is a suggestion that the difference in outcomes between white and non-white immigrants may be rooted in education, as both the Clark and Lindley and Chiswick papers suggest that British education accelerates the assimilation process for immigrants.
- In general non-white immigrants without UK education find themselves disadvantaged. It is plausible that non-transferable skills, particularly language skills, play a significant part here.
| To Top |
References
1 Chiswick, B. (1978), The Effect of Americanization on the Earnings of Foreign-Born Men, Journal of Political Economy, 86, 897-921.
2 Chiswick, B. (1980), The Earnings of White and Coloured Male Immigrants in Britain, Economica, 47, 81-87.
3 Borjas, G. (1985), Assimilation, changes in cohort quality, and the earnings of immigrants.
4 Borjas, G. (1987), Self selection and the earnings of immigrants.
5 Barth et al. (2004), Identifying Earnings Assimilation of Immigrants under Changing Macroeconomic Conditions, The Scandinavian Journal of Economic, 106, 1-22
6 Card, D. (2005), Is the New Immigration Really So Bad?
7 Bell, B. D. (1997), The Performance of Immigrants in the United Kingdom, 333
8 Chiswick (1980), The Earnings of White and Coloured Male Immigrants in Britain
9 Clark and Lindley (2009), Immigrant Assimilation Pre and Post Labour Market Entry: Evidence from the UK Labour Force Survey
10 Clark and Drinkwater (2008), The labour-market performance of recent migrants
11 Catalina Amuedo-Dorantes, Labour Market Assimilation of Recent Immigrants in Spain
12 Amelie Constant & Douglas Massey, Labour market segmentation and the earnings of German guestworkers
13 Pieter Bevelander and Helena Skyt Nielsen, Declining employment success of immigrant males in Sweden, Observed or unobserved characteristics?
14 Michael Baker and Dwayne Benjamin (2004), The Performance of Immigrants in the Canadian Labour Market
15 Heather Antecol and Kelly Bedard, Unhealthy Assimilation: Why Do Immigrants Converge to American Health Status Levels?